



16 mins read
By John Thwaites, Co-Founder, GoReinvent
For a moderate retirement in the UK, a single person needs around £31,700 per year in after-tax income. To generate this from savings on top of the full State Pension, most people need a pension pot of approximately £439,000. The widely used 10x salary benchmark (save ten times your final annual salary by age 67) is a useful starting point, but it only works if you started saving at 25, saved consistently, and retire precisely on schedule. Most people do not fit that model. This article explains what the numbers actually mean for UK earners today, and what your options are if you’re behind where the rule says you should be.
The question sounds simple: How much do I need to retire?
But most people asking it aren’t really looking for a number.
They’re asking something more important: Am I going to be alright?
And for a large proportion of people in their 40s, 50s, and early 60s right now, the honest answer is: you don’t yet have enough clarity to know.
Not because you have done anything wrong but because the way this question is usually answered leaves out too much.
What Is the 10x Retirement Rule?
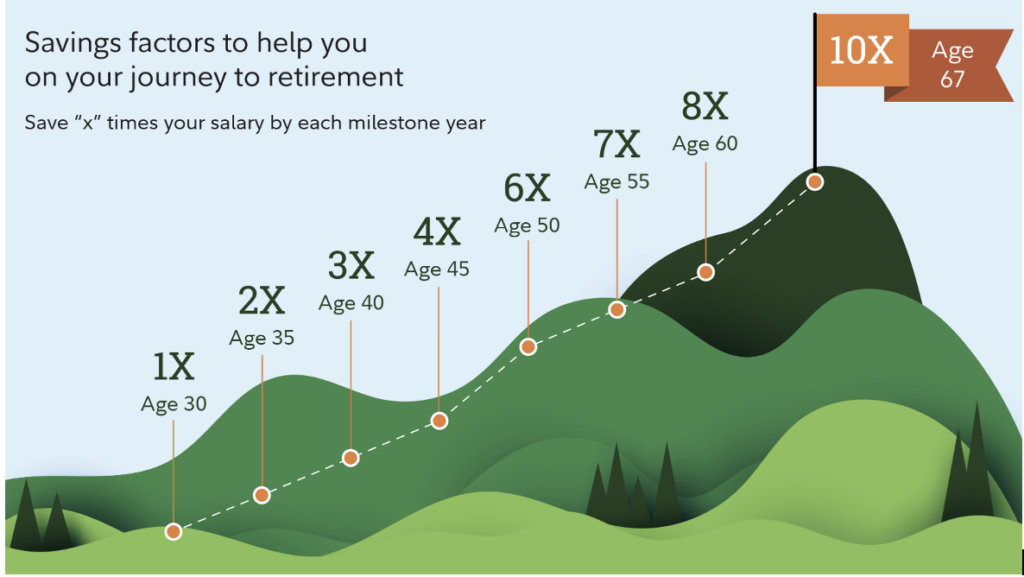
One of the most widely used benchmarks comes from Fidelity Investments, one of the world’s largest retirement research institutions.
By age 67, aim to have saved 10 times your annual salary.
With milestones along the way: 1x by 30, 3x by 40, 6x by 50, 8x by 60.
It’s clean, memorable and on paper, it works but only under a specific set of assumptions.
What Does the 10x Rule Actually Assume?
Fidelity developed this model through extensive market modelling, running historical data under poor market conditions to achieve a 90% confidence level of success. The model assumes you start saving at 25, save 15% of your salary consistently, experience steady income growth of 1.5% per year in real terms, retire at 67, and live through to 93.
The 10x figure is designed to replace roughly 45% of your pre-retirement income. That sounds low, but it accounts for the fact that you’ll no longer be paying into a pension, commuting costs drop away, you may have cleared your mortgage, and some retirement income will come from state benefits.
The target isn’t fixed. Retire at 65 and you would need closer to 12x. Retire at 70 and 8x may be sufficient. For most earners between roughly £33,000 and £200,000, the model is reasonably consistent. Outside that range, it has limited use.
But for many people reading this, at least one of those core assumptions is already broken, sometimes several.
At that point, the question transitions. It’s no longer: What number should I aim for?
It becomes: What happens if I don’t reach that number?
And that is where most retirement advice stops being useful. This is the part most people never see.
What Does the UK Data Actually Show?
To understand your position properly, you need to move past abstract rules and look at real outcomes.
The Retirement Living Standards (RLS), calculated by the Centre for Research in Social Policy at Loughborough University on behalf of the Pensions and Lifetime Savings Association (PLSA), give the most grounded benchmark available for UK retirees.
For a single person in 2025:
| Standard | Annual Income Required |
| Minimum | £13,400 |
| Moderate | £31,700 |
| Comfortable | £43,900 |
For a two-person household:
| Standard | Annual Income Required |
| Minimum | £21,600 |
| Moderate | £43,900 |
| Comfortable | £60,600 |
These figures don’t include rent or mortgage costs and broadly assume the retiree owns their home. They also exclude London, where costs are substantially higher.
In short: the State Pension covers the basics for some, and not much else for most.
The full State Pension from April 2026 is £12,547.60 per year. It gets close to supporting a minimum lifestyle for a single person but doesn’t cover it. The average mean salary for full-time UK workers is around £45,836 per year. The average actual retirement income for a single pensioner is approximately £14,664 per year. That is a drop of roughly 68% from working life.
So, the real question becomes: How do you bridge the gap between what you will have and what you will need?
Most People Are Further From That Bridge Than They Think
This is where the picture sharpens considerably.
Government data from the Department for Work and Pensions, published in 2025, found that an estimated 43% of the working-age population (14.6 million people) are currently under saving for retirement. When measured against the PLSA Moderate standard, almost three in four people (73%) are projected to fall short.
In practice, this shows up in the actual size of pension pots. According to PensionBee data from June 2025, the average UK pension pot across all customers held £21,875. People aged 50 and over are projected to retire with average pots of approximately £87,887. That would provide perhaps £4,000 to £5,000 per year in withdrawals, which, combined with the State Pension, puts most people somewhere around minimum standard at best.
Research from St. James’s Place in 2025 found that nearly half of pension holders estimated their total pension wealth at under £50,000. Three in five UK adults said they were not confident of achieving a moderate standard of living in retirement. Those closest to retirement were the least confident of all, because they have the clearest view of what they have actually saved.
A moderate retirement typically requires a pot of approximately £439,000, according to Standard Life modelling published in May 2025. A comfortable one can exceed £700,000.
That isn’t a small gap and it affects far more people than most financial commentary acknowledges.
This Is Not a Willpower Problem

It’s easy to look at those figures and conclude that people simply haven’t saved enough, but that interpretation misses what’s really happening.
Research by Standard Life found that the average difference between what people think they need in retirement and what they actually need is 58%, or approximately £240,000 per person. Among people aged 50 to 64, two in five report low confidence in meeting their retirement income goals. Of those, 44% say the reason is simply that they do not know how much they will need.
This isn’t a failure of effort, it’s a failure of clarity.
Many people started saving later than the model assumes. Their income didn’t follow a smooth upward path. Life events disrupted consistency. The system around them changed faster than their plans could adjust.
What looks like a personal shortfall is often a mismatch between how life actually unfolds and the model used to plan for it. That distinction matters, because it changes what you do next.
When I was working through my own position in my early 60s, I did this calculation and it changed how I approached the whole question. Not because the number was comfortable, but because clarity turned out to be far less frightening than uncertainty.
What Is 10x Actually Worth?
Let us put the 10x rule into numbers that most UK earners can work with. The table below uses the widely cited 4% annual withdrawal rate (the amount most financial planners consider a sustainable starting point, based on historical modelling by financial researcher William Bengen). It’s a rule of thumb, not a guarantee, and the actual sustainable rate depends heavily on market conditions in the early years of retirement.
| Annual salary | 10x pot | 4% annual withdrawal | Add State Pension (£12,547) | Total income | PLSA benchmark |
| £35,000 | £350,000 | £14,000 | £26,547 | £26,547 | Between minimum and moderate |
| £45,000 | £450,000 | £18,000 | £30,547 | £30,547 | Just below moderate (£31,700) |
| £60,000 | £600,000 | £24,000 | £36,547 | £36,547 | Inside moderate range |
Three things stand out from these numbers.
First, the 10x rule is a minimum, not a target. If your retirement plans include meaningful travel, helping family financially, home improvements, or genuine flexibility, you need to go beyond it.
Second, passive saving at minimum contribution levels will not get most people to even that minimum. The difference between minimum and moderate retirement on an average UK salary is significant, and auto-enrolment at 8% was never designed to close it.
Third, the 4% withdrawal rate is a useful starting point, not a guarantee. It depends heavily on market returns in the early years of retirement. If markets fall badly in the first few years after you stop working, when your pot is at its largest and withdrawals are just beginning, the long-term damage is far greater than you might expect.
This is known as “sequence of returns risk.” Two people with identical pot sizes and identical average returns over 25 years can end up in very different positions depending purely on when the bad years arrived. It’s one of the most underappreciated factors in retirement planning.
This is where the rule makes sense on paper and where its limits become hard to ignore.
The Assumption That Breaks the Model
Most retirement planning is built on one assumption that is rarely questioned.
This is where the model breaks; your income stops, and your savings take over.
That produces a specific picture: work, then stop, then withdraw. A clean break at a fixed point.
But for many people, the reality looks quite different. It looks more like a gradual shift. Reduced income rather than zero. Flexible or part-time work. Periods of earning and not earning. Changing needs at different points in a 25 to 30-year retirement.
Not a switch. A spectrum.
Once you see that, something shifts in how you approach the whole question.
A More Useful Question

Instead of asking how big your pension pot needs to be, a more practical question is this:
How much income do I need, and where will it come from?
That changes retirement from a single number problem into an income design problem.
Your retirement income might come from pension withdrawals, the State Pension, part-time or flexible work, investments, property, or other assets. When you think this way, the pressure moves away from hitting one number and towards building a range of options.
And critically: your pension no longer has to carry the full weight alone.
How Income in Your 60s Changes Retirement
This is the section most financial planning guides leave out, because they approach the problem purely through the lens of savings. And it’s the section where the numbers start to work in your favour.
The 10x model assumes retirement is a switch, not a spectrum. But for a large number of people over 50, particularly those with specialist knowledge, professional experience, and decades of hard-won expertise, the income problem can be approached from a different direction entirely.
If you can generate £10,000 to £15,000 per year in flexible earned income during your early retirement years, through consulting, a small service business, coaching, or a portfolio of part-time work, you change the numbers in a meaningful way.
You draw less from your pension each year. Your pot lasts longer. The total savings you need falls. Your options increase at every stage.
This isn’t a consolation prize for people who did not save enough. It’s not about becoming a coach, a consultant, or an entrepreneur if those words do not fit. It isn’t about starting something small to get by. It’s about finding a way to deploy what you already know, in a way that suits how you want to work now, on your own terms.
And the identity objection is worth naming directly: most people who explore this route are not starting from scratch. They’re applying judgement, relationships, and expertise that took decades to build. That is a different proposition entirely from “launching a business.”
People who remain economically active in some form during their 60s report higher life satisfaction, better cognitive health, and lower financial anxiety, according to research published by the Centre for Ageing Better. The question worth sitting with isn’t only: How large does my pot need to be? It’s also: What if the pot doesn’t need to do all the work alone?
Behind on Retirement Milestones?

If you’ve read this far and the numbers feel uncomfortable, you’re definitely not the only one. The data is clear on that point and even if you’ve never looked at this properly before, that doesn’t put you behind in any way that can’t be addressed.
But this is also a significant moment, because the decisions made in the ten years before retirement have a bigger effect on outcomes than most people realise. Being behind isn’t the same as being out of options.
Save more, if possible. The auto-enrolment minimum of 8% total contributions was never designed to produce a comfortable retirement. Moving towards 12% to 15% makes a real difference over a ten-year horizon, particularly when combined with tax relief and employer matching.
Work longer, if that is genuinely available to you. Every additional year of work reduces the number of years your pot needs to support, allows compounding to continue, and can increase your State Pension if you have National Insurance gaps. In the Fidelity model, retiring at 70 rather than 67 reduces the required savings factor from 10x to 8x.
Build some income for early retirement. Even modest earned income in your early 60s can extend the life of your pension pot by five to ten years. It doesn’t need to replace your salary. It just needs to reduce how much you take from your pot each year.
Look at your housing position honestly. Downsizing and releasing capital from a family home is a significant variable for many people. According to DWP data, 24% of people aged 40 to 75 who have not yet retired expect to release equity or downsize as part of their retirement plan.
The State Pension: Foundation, Not a Plan
The UK State Pension is triple-lock protected, rising each year by the highest of inflation, average earnings growth, or 2.5%. For lower earners especially, it forms a meaningful part of retirement income. But it doesn’t, on its own, support even a minimum standard of living.
The State Pension age is currently 66 for both men and women. It rises to 67 between 2026 and 2028, affecting people born from April 1961 onwards. A further rise to 68 is legislated for 2044 to 2046, affecting those born from April 1977. Both timelines are subject to review.
The UK spent approximately £138 billion on State Pension provision in 2024/25, around 5% of GDP. That figure is projected to reach 7.7% of GDP by the early 2070s. The pressure to raise the State Pension age further isn’t occasional, it’s ongoing and has a financial logic behind it.
The practical implication for anyone in their 40s or 50s today is straightforward: do not build a retirement plan that depends on the State Pension age staying where it is.
Which brings the question back to where it started. Not how much the State Pension will give you but how much you’ll need on top of it, and where that comes from.
This article does not constitute regulated financial advice. For guidance specific to your circumstances, speak to a qualified financial adviser.
Frequently Asked Questions
How much do I need to retire in the UK? For a moderate standard of living (which includes a car, one foreign holiday per year, and eating out occasionally) a single person currently needs around £31,700 per year in after-tax income. To generate this from a pension pot on top of the full State Pension, you would typically need savings of approximately £439,000, depending on how you draw the income.
What is the 10x retirement rule? It’s a benchmark developed by Fidelity Investments suggesting that by retirement at 67 you should have saved ten times your final annual salary. The milestones are 1x by 30, 3x by 40, 6x by 50, and 8x by 60. It assumes a 15% savings rate throughout your working life and is designed to replace roughly 45% of your pre-retirement income, with the rest coming from state benefits.
Is the UK State Pension enough to live on? No. The full new State Pension from April 2026 is £12,547.60 per year. The minimum PLSA Retirement Living Standard for a single person is £13,400. Even to reach minimum standard, you need additional savings or income beyond the State Pension. For a moderate or comfortable retirement, the gap is considerably larger.
What age can I access my pension in the UK? Most private and workplace defined contribution pensions can currently be accessed from age 55. This is rising to 57 from April 2028. The State Pension can only be claimed once you reach State Pension age, currently 66 and rising to 67 between 2026 and 2028.
How much does the average person in the UK have saved for retirement? According to PensionBee data from 2025, the average UK pension pot is approximately £21,875. For people aged 50 and over, projected average pots at retirement are around £87,887. ONS data suggests average pension wealth for those aged 55 to 74 is approximately £140,000. None of these figures are close to the savings required for a moderate standard of living.
What if I haven’t saved enough for retirement? You still have options: increasing contributions now, working longer if available, building some flexible earned income in your 60s, and reviewing your housing position. For many people, a combination of modest earned income in early retirement and a smaller pension pot can still produce a workable outcome. The key is understanding your specific gap first.
Is it too late to start saving for retirement at 50? No. A 50-year-old who contributes consistently over fifteen to seventeen years, taking full advantage of employer matching, tax relief, and carry-forward of unused pension allowances, can build a meaningfully larger pot. It requires a higher savings rate than starting at 25, but it is not too late.
What is the difference between the PLSA minimum, moderate, and comfortable retirement standards? The Minimum standard (£13,400 per year for a single person) covers essentials plus a short UK holiday, but no car. The Moderate standard (£31,700) adds a car, a European holiday, and more day-to-day flexibility. The Comfortable standard (£43,900) allows for longer foreign holidays, home improvements, and broader financial freedom. Loughborough University calculates these annually on behalf of the PLSA.
What is “sequence of returns risk”? It’s the risk that poor investment returns early in retirement cause permanent damage to a pension pot, even if long-term average returns look acceptable. Because withdrawals begin when the pot is at its largest, early losses reduce the base from which future growth can recover. Two people with identical average returns over 25 years can end up in very different positions depending on when the bad years fell.
The answers in this FAQ are for general information only and do not constitute regulated financial advice. For guidance specific to your circumstances, speak to a qualified financial adviser.
Where Do You Actually Stand?
The numbers in this article are useful anchors, but they are still general. And your situation isn’t.
This is where most people get stuck. They understand the rules and the risks, but they don’t know where they personally stand. And without that, every decision is guesswork.
The Pension Reality Check is a short, 13-question assessment that takes around five minutes to complete. Answer honestly, and within ten minutes you’ll receive a personalised Retirement Options Report based on your age, your savings, your target, and your likely gap.
No regulated financial advice, no jargon, and no sales pitch – just a clear picture of where you stand.
Most people are surprised by what they see.
Take the Pension Reality Check
Final Thought

The 10x rule isn’t wrong but it’s incomplete.
And for many people, it creates a false sense of certainty around something that is far more flexible than it appears.
The goal isn’t to find a perfect number. It’s to understand your position clearly, and build enough flexibility into your future that you have real options.
That starts with clarity.
Sources and Data
- Fidelity Investments – “How Much Do I Need to Retire?” savings factor methodology and 10x rule. Based on Consumer Expenditure Survey (BLS), IRS tax brackets, and Social Security Benefit Calculators. Market simulations assume poor market conditions at 90% confidence level. fidelity.com
- Fidelity Investments – “Average Retirement Savings by Age.” Q4 2024 data based on 26,700 corporate defined contribution plans and 24.5 million participants. fidelity.com
- Pensions and Lifetime Savings Association (PLSA) / Loughborough University – Retirement Living Standards 2025. Minimum: £13,400 (single), £21,600 (couple). Moderate: £31,700 (single), £43,900 (couple). Comfortable: £43,900 (single), £60,600 (couple). retirementlivingstandards.org.uk
- Department for Work and Pensions (DWP) – “Analysis of Future Pension Incomes 2025.” Published July 2025. 43% of working-age population (14.6 million) undersaving. 73% projected below PLSA Moderate standard. gov.uk
- PensionBee Pension Landscape 2025 – Average UK pension pot: £21,875 (June 2025). Projected pot for over-50s at retirement: £87,887. pensionbee.com
- St. James’s Place Financial Health Report 2025 – Three in five UK adults not confident of moderate retirement. 48% of pension holders estimate under £50,000 saved. sjp.co.uk
- Scottish Widows 20th Annual Retirement Report (2024) – 38% of people not on track for PLSA minimum standard. 54% expect to work longer than they want to. pensionsage.com
- Standard Life / Phoenix Group – Average pension under-provision: £240,000 (58% gap between expected and required pot). Pot required for single moderate retirement: approximately £439,000 (annuity basis, May 2025 rates). Pot required for single comfortable retirement: approximately £709,000. standardlife.co.uk
- Office for National Statistics (ONS) – Mean full-time salary UK 2024: £45,836. Average retirement income single pensioner: £14,664. Average pension wealth ages 55 to 74: approximately £140,000. ons.gov.uk
- State Pension 2026/27 – Full new State Pension from April 2026: £12,547.60 per year (£241.10 per week). State Pension age currently 66, rising to 67 between 2026 and 2028, legislated to rise to 68 between 2044 and 2046. gov.uk
- Centre for Ageing Better – The State of Ageing 2023/24 – UK pensioner poverty rate approximately 18%. More than a quarter of pensioners (27%) have under £1,500 in savings. Research on economic activity and wellbeing in later life. ageing-better.org.uk
- Resolution Foundation – “Revisiting the State Pension Age.” UK State Pension expenditure 5% of GDP in 2024/25 (approximately £138 billion), projected to reach 7.7% of GDP by early 2070s. resolutionfoundation.org
- Bengen, W.P. (1994) – “Determining Withdrawal Rates Using Historical Data.” Journal of Financial Planning. Origin of the 4% withdrawal rate rule of thumb based on US historical market data. Used here as an illustrative starting point only.
